A network of stream gages record and telemeter river stage information. Flow measurements by field crews help calibrate and confirm calculations. Data from stream gage telemetry requires careful consideration as field conditions and equipment malfunctions can provide erroneous readings. A more accurate assessment of actual flow rates requires a review of the flow record and processing to account for actual conditions. This Quality Assurance Quality Control flow data is available on the Data Download page.
Status | River’s End | Forecasts | Real-Time | Measurements
Real Time Stream Gauge Data | Top
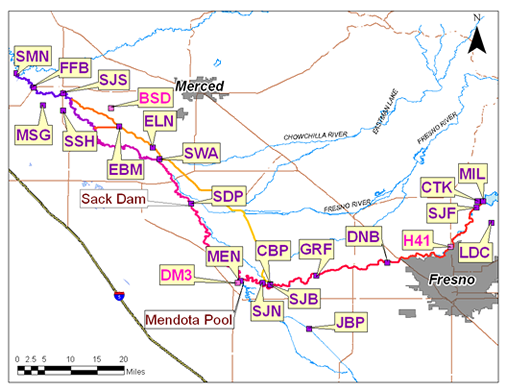
Telemetered stream gauge stations with stage/flow information are available at the California Data Exchange Center, click on the map below.
Gaging Station Updates
- 11/8/2012 – SJN – A continuous water temperature and specific conductance sonde was installed at the gage. real-time measurements are incorrect while installation quirks are fixed.
- The water level recorder cable in MW-09-89 rusted through and recorded a sudden drop in groundwater level on 10/27/2011. The cable was re-measured and adjusted on CDEC on 10/31/2011 at 15:00 hours.
- Gaging Station SJB changed from reporting in elevation to reporting in stage on 8/28/2011.
Tracking the River’s End | Top
The following maps show the location of the river front over time.
- 10/4/2009 – 11/6/2009
- 11/16/2009 – 11/20/2009
- 2/1/2010 – 2/25/2010
- 2/25/2010 – 3/2/2010
- 2/17/2016 – 7/21/2016; kmz file: End of SJR 20160715.zip
- Reach 4A: 8/17/2016 – 10/11/2016; kmz file: endofsjr_2016_oct11
Movie of the San Joaquin River on April 12, 2016:
Millerton Daily Operations Report | Top
This Report consists of the previous day’s Friant release flow rate and other data.
Measurements | Top
- Flow and Stage Atlas
- Flow Atlas Maps
- Stage Atlas Maps
- Graphs
- Manual Measurements for Gage Shift Corrections
SJRRP staff manually measure at gage locations to verify and adjust rating curves. Posted results provide provisional estimates subject to revision during review and finalization. Below are USGS measurements and links to the USGS NWIS database containing all USGS measurements. Please see the Reclamation and DWR measurement spreadsheet on the data page.
Below Friant – See all measurements here
San Mateo Ave – See all measurements here
Below Mendota – See all measurements here
Posted results provide provisional estimates subject to revision during review and finalization.
Manual Measurements at Non-Gaged Locations
Other manual measurements of flow rates done periodically are available in the Annual Technical Report.